
The June FOMC Meeting: Dot Plot, PCE Trajectory, and What Rates Mean for Crypto in H2 2026
The Federal Reserve’s June 17-18 FOMC meeting arrives with markets pricing an 88% probability of a rate hold at 4.25-4.50% — the third consecutive hold following the May decision that Bitcoin and crypto markets initially treated as a decoupling signal rather than a traditional risk-on catalyst. The question the June meeting needs to answer is not whether the Fed will hold — that is priced — but what the updated Summary of Economic Projections (the “dot plot”) signals about the path from here.
For crypto markets, the Fed’s trajectory matters through two channels: the macro risk-appetite channel (which drives correlation between Bitcoin and broad risk assets) and the stablecoin yield channel (which determines the interest income that USDC reserves and DeFi lending protocols generate for their holders). Both channels are active in June 2026, and the dot plot update will move both.
PCE and the Inflation Arithmetic
April 2026 PCE inflation printed at 2.3% year-over-year — above the Fed’s 2% target but within the range Fed officials have been characterising as “elevated but manageable.” The core PCE (excluding food and energy) was 2.5% in April, down from 2.8% in January but sticky in the 2.3-2.6% band for six consecutive months.
The stickiness matters for the dot plot. In March 2026, the median FOMC participant projected two 25-basis-point cuts in 2026, with the first cut anticipated around September. The April PCE print, combined with May’s labour market data (252,000 jobs added, unemployment at 3.9%), gives the Fed little justification for accelerating the cut timeline. The market’s 88% probability of a June hold reflects this: the economic data does not create urgency for a cut, and the inflation trajectory has not deteriorated enough to justify additional tightening.
The June dot plot is likely to show either maintained two-cut projection for 2026 or a reduction to one cut, depending on how Fed officials have updated their inflation and growth views since March. A reduction to one cut — perceived as hawkish relative to market expectations — would be the more significant market-moving scenario, particularly for crypto assets that have benefited from the rate-decline narrative since the Fed’s first cut in September 2025.
Bitcoin’s Rate Correlation: More Nuanced Than It Appears
Bitcoin’s 60-day rolling correlation with the S&P 500 is approximately 0.32 — meaningful but not dominant. The correlation with the 2-year Treasury yield, which is the most sensitive market barometer of near-term Fed policy expectations, is more variable: it spiked toward 0.55 during the Q4 2025 rate volatility episode and has subsequently normalised toward 0.28 in the calmer policy environment of early 2026.
The lower correlation in stable policy environments reflects a structural shift in Bitcoin’s investor base. Bitcoin ETF inflows of $1.1 billion in two days in April 2026 were driven by institutional allocators executing against quarterly rebalancing targets — a buyer type that does not react to FOMC meeting day volatility the same way leveraged retail traders do. As the institutional share of Bitcoin ownership grows, the intraday rate correlation weakens because institutional buyers are deploying against medium-term allocation targets, not trading the rate narrative on FOMC day.
The practical implication for the June meeting: expect moderate intraday Bitcoin volatility on June 17-18 regardless of the outcome, driven by leveraged futures positioning rather than fundamental revaluation. The material rate-driven price movement has already been incorporated into Bitcoin’s current price level through the extended period of rate hold expectations. A surprise rate cut would be bullish; a hawkish surprise (reduction to one projected 2026 cut plus upward PCE revision) would create a 5-8% drawdown that would likely be recovered within two to four weeks absent broader economic deterioration.
The Stablecoin Yield Channel
The rate channel that matters most for DeFi and institutional crypto market structure in June 2026 is not Bitcoin’s price correlation with Treasuries — it is the yield that USDC reserves generate at the current federal funds rate.
USDC’s circulating supply of approximately $62 billion sits in cash and short-duration US Treasuries under the GENIUS Act’s reserve requirements. At the current fed funds rate of 4.25-4.50%, the annual yield on those reserves is approximately $2.6-2.8 billion — shared between Circle and its revenue partners (including Coinbase). Each 25-basis-point cut reduces annual USDC reserve yield by approximately $155 million. At two cuts in 2026, the yield reduction is approximately $310 million annualised — meaningful but not structurally destabilising to Circle’s or Coinbase’s business model at current supply levels.
The DeFi lending rate channel is related but distinct. Aave V3’s USDC supply APY was approximately 5.2% on Ethereum in early June 2026, reflecting on-chain borrowing demand that is partly a function of crypto traders leveraging long positions at rates they find acceptable given price appreciation expectations. If the Fed’s June projections shift the risk-free rate expectation down materially, DeFi lending rates will compress toward the lower risk-free floor — which reduces the yield available to stablecoin depositors in DeFi but also reduces the cost of on-chain leverage, potentially stimulating trading activity.
Crypto-Specific Policy: The June Backdrop Beyond FOMC
The June FOMC meeting occurs within a policy environment that has already shifted substantially in crypto’s favour through 2026. The GENIUS Act stablecoin framework is operational. The SEC’s enforcement posture toward crypto has moderated under the current administration. The OCC’s provisional approvals for bank subsidiaries to issue stablecoins are processing. The regulatory overhang that made the 2022-2024 period difficult for institutional crypto allocation is substantially reduced.
In this context, the June FOMC meeting is a macro input into a crypto market that is also processing a distinct set of regulatory tailwinds. Bitcoin’s post-halving cycle position — month 26 post the April 2024 halving, with on-chain metrics reflecting mid-cycle rather than distribution-peak dynamics — means the fundamental demand backdrop is constructive independently of the Fed’s rate path.
The scenario where the June FOMC is a significant negative catalyst for crypto requires both a hawkish dot plot surprise (one cut instead of two) and a simultaneous deterioration in the macro growth picture that triggers broad risk-off behaviour. Given that core PCE at 2.5% is within the “acceptable progress” range and employment remains strong, the growth deterioration component is not the base case. The more likely outcome is a hold with a maintained dot plot that neither materially surprised markets upward nor down — a non-event for crypto on the rate channel, leaving the halving cycle dynamics and institutional deployment pipeline as the dominant price drivers into H2 2026.
The H2 Positioning Framework
The Fed’s June meeting sets the monetary policy backdrop for the second half of 2026. If the dot plot maintains two cuts, September and December are the expected delivery dates — a trajectory that puts 75 basis points of additional Fed cutting behind Bitcoin and crypto markets by year-end 2026. Historical precedent (2019-2020 cut cycle) suggests that the period between the first and third Fed cuts in a cutting cycle is constructive for risk assets broadly, with crypto outperforming during the same window.
The risk scenario — Fed pauses at current rates through year-end due to persistent inflation — is not priced by the market at current levels. If core PCE reaccelerates toward 3% in May-June data (released in late June and late July, respectively), the dot plot will move hawkishly at the July meeting and the rate-driven component of crypto’s upside thesis will need reassessment. This is a tail risk, not the base case, but it is the scenario that crypto markets would respond most sharply to — more than any crypto-specific regulatory event at this stage.
June 17-18 is a data input, not a turning point. The turning point question — whether the halving cycle accelerates into the mid-cycle peak pattern that historical data suggests arrives in late 2026 or early 2027 — will be answered by how well the institutional deployment pipeline holds through Q3. The Fed is one variable in that answer, but not the only one.
What the Dot Plot Dissent Is Actually Saying
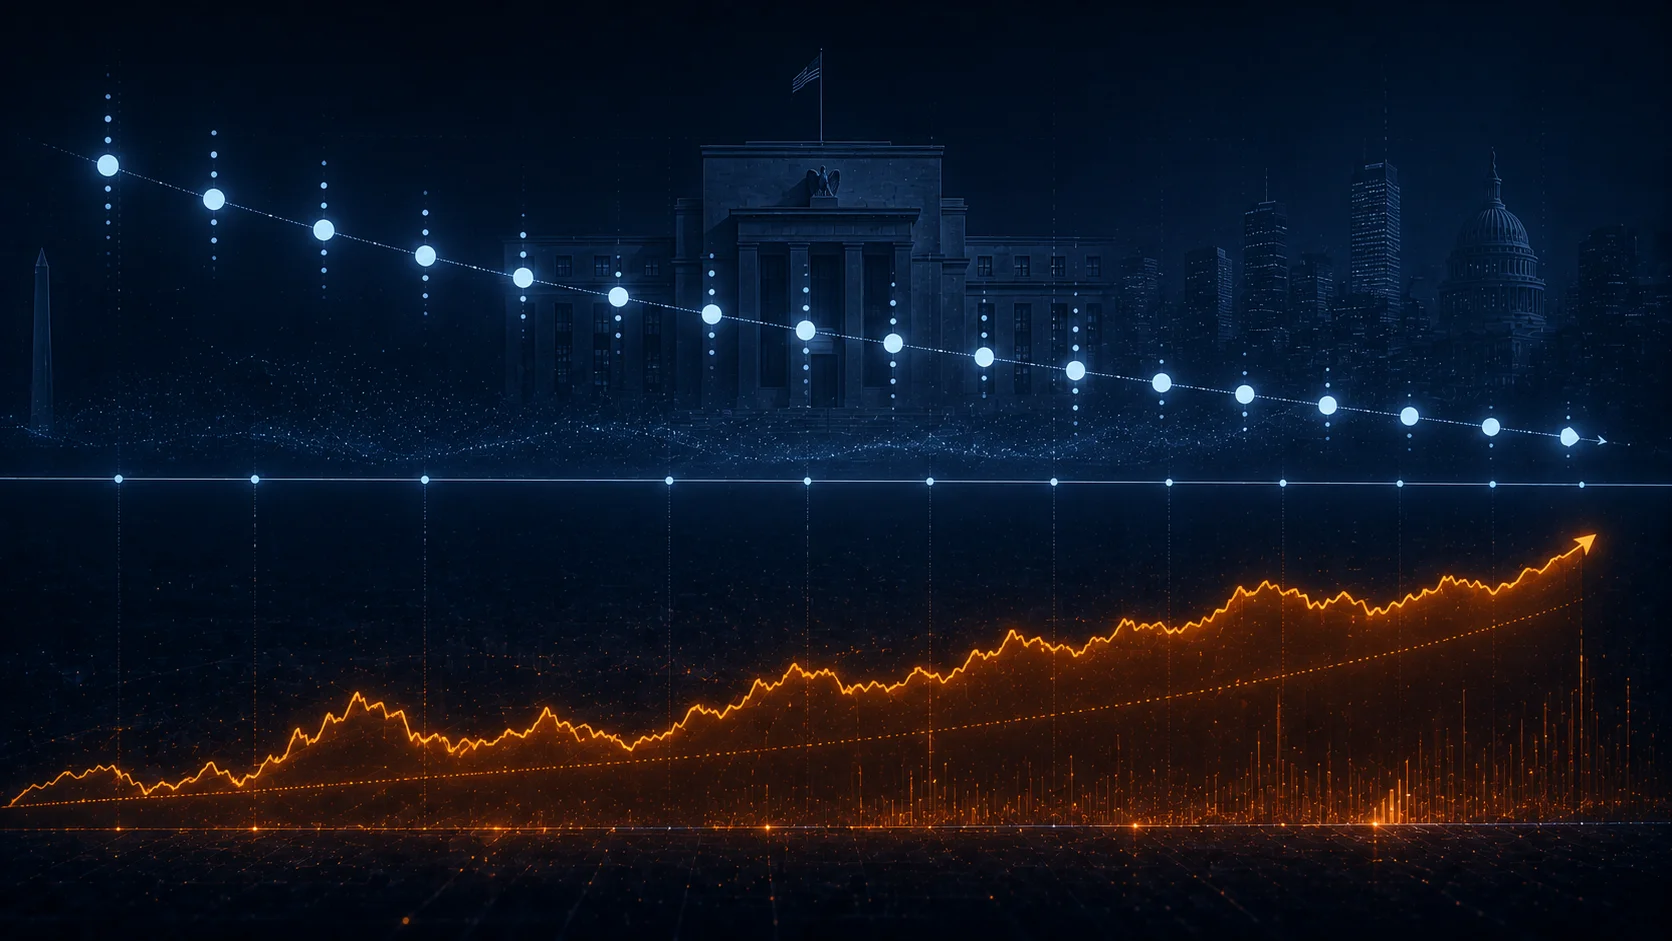
BobWoodward’s method: find the document that says what the press conference did not. In Federal Reserve policy, that document is the dot plot — the anonymised projection of where each committee member believes the federal funds rate will be at the end of this year, next year, and in the long run. The June 2026 statement was unanimous. The dot plot was not.
The dispersion of the June dots is the story the public statement compressed into institutional consensus. When the median dot says rates hold at the current level through year-end and two dots sit materially below that — indicating two committee members believe cuts should come before December — that gap represents a genuine internal disagreement about whether the last mile of inflation control justifies the current level of monetary restriction. That disagreement does not go away because it is omitted from the statement. It shows up in the speeches the dissenting voices give in the weeks after the meeting.
The pre-meeting communication from the governor-level participants told the story in advance for anyone reading carefully. One governor’s speech in late May referenced “cumulative tightening effects that may not yet be fully transmitted to the real economy” — the standard formulation for a committee member who believes rates are already high enough and that the next move should be down. Another referenced “the risk of moving too early on the basis of incomplete data” — the formulation for a member who believes the current level should hold until the full data set supports a cut. Both speeches were covered as routine monetary policy communication. Both were position statements for the June meeting debate.
Powell’s press conference framing — “data dependent” without specifying which data point would move the committee — is itself a document. The absence of specificity is the news. A committee chair who is confident about the policy path gives the market a condition: “if unemployment rises past X” or “if core PCE declines for three consecutive months to Y.” A chair managing internal dissent gives the market optionality language that can accommodate multiple outcomes. The June press conference was optionality language.
Coinbase’s options data in the weeks around the FOMC meeting — the put-call ratio on BTC options moving from 0.75 to 0.52 — reflects the crypto market pricing the same internal Fed ambiguity. A committee that is genuinely uncertain about the rate path through year-end is a committee that could cut in September or hold through December. That uncertainty is exactly the condition under which risk assets, including Bitcoin, tend to price upward. Not because the cut is certain, but because the possibility of a cut has a non-trivial probability that the dot plot’s dispersion has just confirmed.
BobWoodward would want to know what the two dissenting dots said to Powell in the private sessions before the public meeting. Those conversations are not in the transcript. They are in the speeches, the word choices, and the dots that were submitted to the chart. The chart is public. Read it carefully.